 The Lemon Index
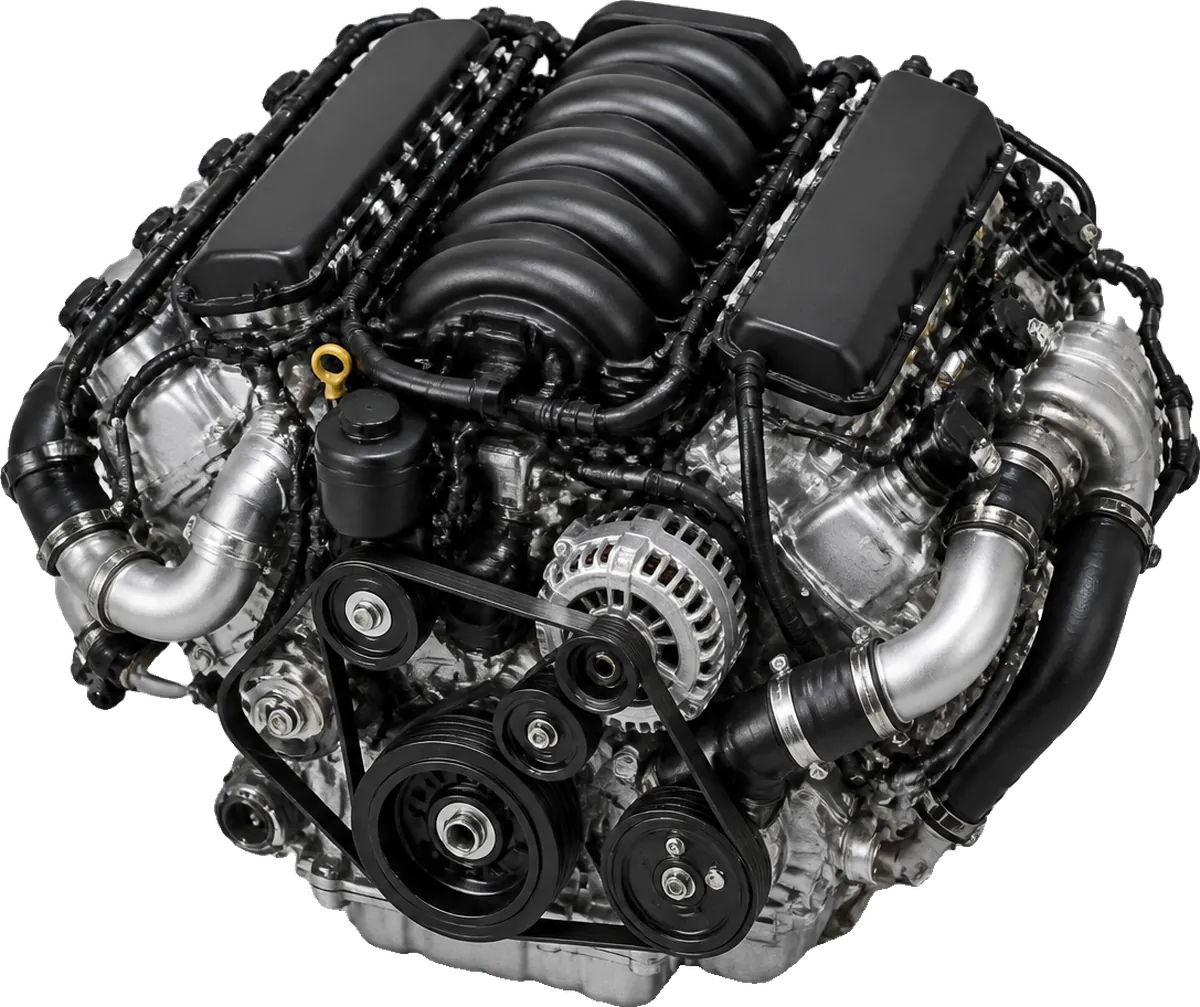
The 3.4 L V6 twin-turbo, hybrid in the Toyota Tundra and Toyota Sequoia, model years 2022–2025. Owners filed 307 complaints about cars with it (matched by VIN); 34% name the engine, #14 of the 51 everyday engines we track (1 = the most).
Known issues, checked against owner complaints
Problems owners of cars with this engine name much more often than owners of the other 50 everyday engines we track (at least 1.5× the median, and 10+ complaints):
- Engine knock and failure. 40 of 307 owner complaints (13%) say the engine knocked, seized or failed, against a median of 2.7% for the other 50 everyday engines we track.
Hybrid system malfunctioned and engine completely seized up. Dealer/Toyota is replacing the short block and both turbos on my Sequoia. This seems to be the same issue as the Tundra engines.
2023 owner · NHTSA complaint 11681251 - The hybrid system. 28 of 307 owner complaints (9.1%) mention the hybrid battery, inverter or hybrid system, against a median of under 0.1% for the other 50 everyday engines we track.
Hybrid system malfunctioned and engine completely seized up. Dealer/Toyota is replacing the short block and both turbos on my Sequoia. This seems to be the same issue as the Tundra engines.
2023 owner · NHTSA complaint 11681251
Also often talked about, but not standing out in complaints to NHTSA: stalling and loss of power (47 of 307, 15%, peers 12%). That doesn't mean it never happens, only that owners rarely file it with the government.
What YouTube owners say
Average owner tone 50/100 across 4 model years, from 158 videos about this engine and its cars (#219 of 409 engines with a YouTube study).
Most-watched videos
- NEVER Buy a Toyota Like THIS ONE! Hint : It's not The Sequoia! 1,526,229 views
- Should You Buy a 2023 Toyota Sequoia? In Depth Review By a Mechanic 701,631 views
- Selling My Sequoia TRD Pro After Only 6 Months Of Ownership - Pros and Cons 412,749 views
- Toyota's i-FORCE MAX One-Motor Hybrid System 405,813 views
- Toyota Tundra Buyer’s Guide | Hybrid Power and up to 4,500kg Braked-Towing Capability 159,046 views
Counted from video titles and captions: praise words against trouble words, weighted by views. Videos only count when the title names this engine or a car that had only this engine in those years.
Cars with this engine Tap a year for that car's full report.
Model years from NHTSA VIN decoding of owner complaints. Only years we have a car page for.
Owner complaints by model year
How to read this chart
Counts of complaints filed so far. Older cars have had longer to collect them, and popular cars draw more because more were sold: no one reports sales by engine, so there's no per-car rate. Compare the shares below instead.
By car
| Car | Model years matched | Complaints | Name the engine |
|---|---|---|---|
| Toyota Tundra | 2022–25 | 218 | 44% |
| Toyota Sequoia | 2023–25 | 89 | 9% |
“Name the engine” = the share of that car's VIN-matched complaints that list the engine as a problem area.
What owners complain about
Share of this engine's complaints that name each area (one complaint can name several).
What owners write
| Complaints that | Count | Share | Median, other everyday engines |
|---|---|---|---|
| Say the engine stalled, shut off or lost power | 47 | 15% | 12% |
| Say the engine knocked, seized or failed | 40 | 13% | 2.7% |
| Mention the hybrid battery, inverter or hybrid system | 28 | 9.1% | under 0.1% |
| Mention the turbo | 16 | 5.2% | under 0.1% |
| Mention fire, flames or smoke | 10 | 3.3% | 3.3% |
| Mention coolant loss or overheating | 6 | 2.0% | 1.2% |
Counted from the owner's own words in each complaint (all of the car, not only the engine). A share, not a failure rate.
When problems show up
Half of the owners who gave a mileage reported the problem between 2,700 and 22,000 miles; the middle report was at 12,000 miles (31 complaints with a mileage).
Recalls that name this engine
No NHTSA recall on these cars and years names this engine.
NHTSA recalls on these cars and model years whose text names this engine (its size or name). The rest (brakes, air bags, wiring ...) are on each car year's page.
In owners' words
SRS Airbag Light triggered with someone was seated in the passenger seat due to the circuit board in the seatbelt malfunctioning. If not replaced could cause airbag issues or seatbelt might not work properly. Took car to dealer before had an accident.
2024 owner · NHTSA complaint 11777543
Throttle response pressed gas nothing for 2 seconds then high rpm this a safety issue already took to dealer they say battery needs charging change driving habits I only drive in city this shouldn't happen
2025 owner · NHTSA complaint 11776115
On 10/30/2026 I was driving the vehicle and the engine started vibrating. Then the engine died and would not restart. The dashboard lights up when trying to start, but the engine will not turn over. I had the vehicle towed to Auto Nation Toyota Gulf Freeway in Houston, TX.
2023 owner · NHTSA complaint 11775074
Against the other everyday engines
| Engine | Years | Complaints | Name the engine | Stalled or lost power | Burning oil | Recalls naming it |
|---|---|---|---|---|---|---|
| 1.5 EcoBoost | 2014–25 | 5,627 | 66% | 15% | 0.2% | 2 |
| 6.2 V8 (Gen V) | 2014–25 | 7,233 | 65% | 24% | 2.2% | 2 |
| Skyactiv-G 2.5T | 2016–25 | 632 | 56% | 8.4% | 9.0% | 0 |
| 2.4 Theta II | 2010–22 | 21,564 | 51% | 20% | 8.1% | 8 |
| 2.4 Ecotec | 2010–17 | 6,098 | 51% | 21% | 18% | 0 |
| 3.0 EcoDiesel | 2014–23 | 2,874 | 50% | 24% | 0.2% | 7 |
| 3.3 Lambda II | 2013–21 | 3,258 | 50% | 17% | 5.9% | 2 |
| 2.0 EcoBoost | 2012–25 | 9,748 | 48% | 12% | 0.1% | 0 |
| 2.0T Theta II | 2011–22 | 3,327 | 44% | 18% | 4.7% | 2 |
| M57 diesel | 2009–13 | 316 | 40% | 16% | 0.3% | 4 |
| 1.4 Turbo | 2011–22 | 3,928 | 39% | 17% | 0.9% | 2 |
| 2.0 diesel | 2014–18 | 223 | 37% | 24% | under 0.1% | 2 |
| 2.4 Tigershark | 2014–22 | 9,634 | 35% | 34% | 4.5% | 5 |
| i-FORCE MAX | 2022–25 | 307 | 34% | 15% | under 0.1% | 0 |
| 1.5 Turbo | 2016–25 | 4,477 | 33% | 27% | 0.3% | 1 |
| EA888 2.0T | 2009–25 | 7,455 | 29% | 16% | 3.6% | 5 |
| A25A | 2018–25 | 2,988 | 26% | 12% | under 0.1% | 1 |
| 3.8 V6 (G6DA / G6DJ) | 2006–16 | 2,098 | 26% | 16% | 0.6% | 0 |
| 1.5 Turbo | 2017–22 | 8,078 | 25% | 13% | 0.2% | 0 |
| J35 V6 | 2003–25 | 24,081 | 24% | 14% | 0.9% | 4 |
| Skyactiv-G 2.5 | 2014–25 | 2,634 | 22% | 11% | 2.7% | 1 |
| 2.7 Turbo | 2019–25 | 1,098 | 22% | 12% | 0.5% | 0 |
| 2AZ-FE | 2001–09 | 7,176 | 22% | 3.7% | 8.6% | 0 |
| 3.0 TFSI | 2009–19 | 693 | 22% | 6.6% | 6.5% | 0 |
| 5.4 Triton | 2005–14 | 3,952 | 21% | 15% | 0.1% | 3 |
| 5.7 HEMI | 2003–24 | 23,907 | 19% | 23% | 0.1% | 6 |
| QR25DE | 2002–20 | 16,167 | 19% | 14% | 1.5% | 4 |
| 5.3 V8 (Gen V) | 2014–25 | 13,198 | 18% | 13% | 0.5% | 3 |
| 3.6 Pentastar | 2011–25 | 34,649 | 18% | 16% | 0.4% | 9 |
| 6.0 Two-Mode Hybrid | 2009–12 | 113 | 18% | 18% | under 0.1% | 0 |
| 2.3 EcoBoost | 2015–25 | 3,983 | 16% | 9.9% | 0.1% | 12 |
| 3.8 Lambda II | 2020–25 | 4,433 | 16% | 8.0% | 5.6% | 0 |
| 2.0 hybrid | 2014–25 | 2,261 | 16% | 10% | under 0.1% | 3 |
| FB20 | 2012–25 | 2,336 | 15% | 8.2% | 1.7% | 0 |
| 3.6 V6 | 2009–23 | 14,218 | 14% | 14% | 0.1% | 1 |
| K24 | 2002–19 | 15,084 | 14% | 5.1% | 1.6% | 0 |
| 2GR-FKS | 2016–24 | 3,775 | 12% | 11% | 0.2% | 2 |
| 3.5 Cyclone V6 | 2007–19 | 21,316 | 12% | 11% | 0.1% | 0 |
| VQ35 V6 | 2002–25 | 12,617 | 12% | 11% | 0.2% | 1 |
| 3UR-FE | 2007–21 | 1,378 | 12% | 8.8% | 0.4% | 0 |
| 4.6 V8 | 2000–11 | 8,651 | 12% | 6.9% | under 0.1% | 3 |
| FB25 | 2011–25 | 9,863 | 11% | 6.2% | 1.5% | 0 |
| 2AR-FE | 2009–18 | 4,675 | 11% | 6.6% | 1.3% | 1 |
| 2GR-FE | 2005–18 | 8,682 | 10% | 3.5% | 0.3% | 0 |
| 2.0 hybrid | 2013–20 | 995 | 10% | 12% | 0.1% | 0 |
| 3.8 V6 | 2007–11 | 7,877 | 9% | 17% | 0.5% | 0 |
| 5.3 V8 (Gen IV) | 2007–14 | 9,241 | 8% | 4.5% | 1.3% | 0 |
| 1GR-FE | 2003–24 | 5,757 | 7% | 4.0% | under 0.1% | 0 |
| 2.5 hybrid | 2012–25 | 1,923 | 7% | 5.8% | 0.1% | 2 |
| 4.8 V8 | 2007–13 | 726 | 6% | 4.8% | 0.1% | 0 |
| 2.3 Duratec | 2001–11 | 639 | 4% | 2.5% | under 0.1% | 0 |
Shares of each engine's own complaints, matched by VIN. They show what owners complain about, not how often engines break.
Quick answers
Is the Toyota 3.4 twin-turbo V6 hybrid (i-FORCE MAX) reliable?
No one reports sales by engine, so there's no per-car score. Of the 307 complaints owners filed about cars with it, 34% name the engine, #14 of the 51 everyday engines we track (1 = the most). 40 (13%) say the engine knocked, seized or failed, against 2.7% for the other engines. 28 (9.1%) mention the hybrid battery, inverter or hybrid system, against under 0.1% for the other engines.
What cars have the Toyota 3.4 twin-turbo V6 hybrid (i-FORCE MAX)?
In our data: the Toyota Tundra and Toyota Sequoia, model years 2022–2025, matched by the VIN in each owner complaint.
What are the most common i-FORCE MAX problems?
In owner complaints to the government: engine, transmission & drivetrain, body structure.
How many recalls name the i-FORCE MAX?
0 NHTSA recalls on these cars name it.
Complaints: NHTSA owner complaints filed under each car's own NHTSA names (the same ones its car pages count), all years filed, one per complaint number. Engine: decoded from the complaint's VIN with NHTSA's vPIC decoder (displacement, cylinders, engine model, turbo, hybrid) and the engine maker's model years; a VIN that doesn't decode to exactly one engine is left out. Older cars have had more years to collect complaints, and popular cars draw more because more were sold. Source: NHTSA owner complaints (FLAT_CMPL + COMPLAINTS_RECEIVED_2025-2026), received through 20261115; engines: NHTSA vPIC VIN decoder (batch); NHTSA recalls API. Engine names and model years: Toyota.