 The Lemon Index
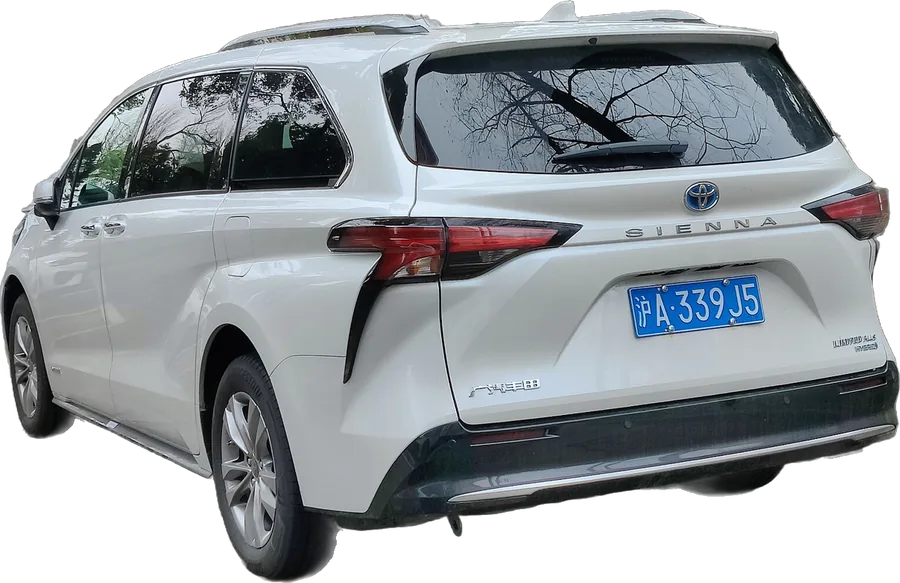
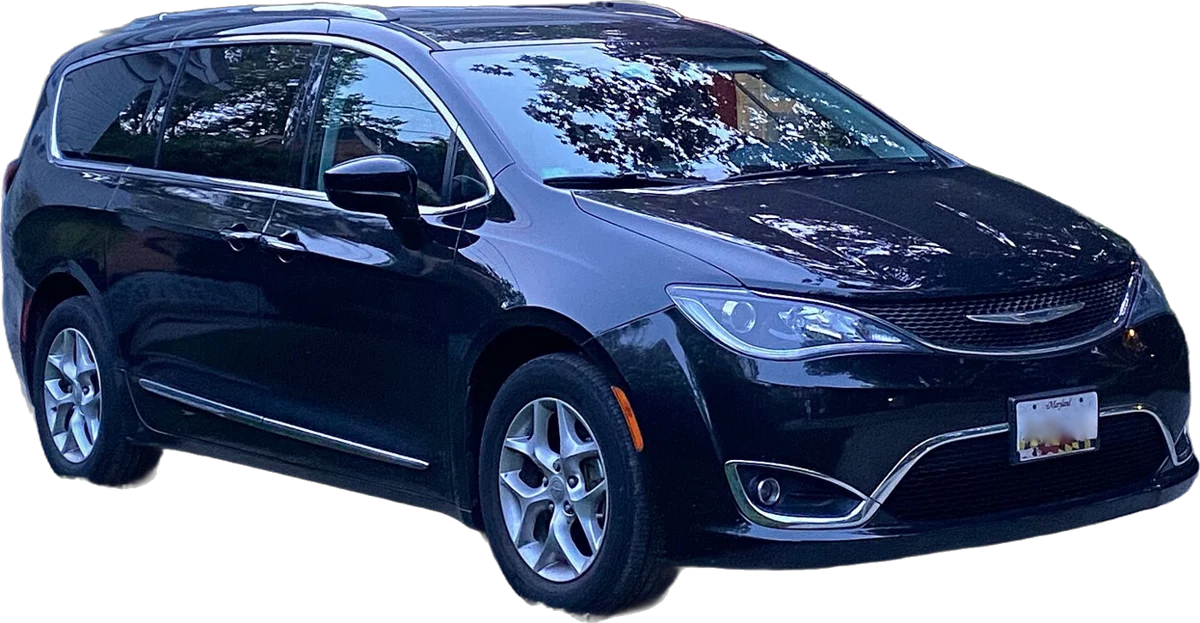
Winner
Toyota Sienna
About 80% fewer owner complaints per car sold than the Chrysler Pacifica, and fewer in 4 of 4 model years both were sold.
Head to head
Lemon Index
100 = average, lower is better
100 = average, lower is better
57
279
Years with fewer complaints
2017–2020
2017–2020
4 of 4
0 of 4
Recalls
2017–2020
2017–2020
26
38
MPG
latest year
latest year
20–21
20–30
Crash test
best, latest year
best, latest year
★★★★★
★★★★★
Best year to buy
Lemon Index = safety complaints filed with the government within 3 years, per car sold, against the average car of the same model year. 100 is average, lower is better. Green check = the better of the two on that line.
Year by year
Shorter bar = fewer complaints per car sold. Tap a year for its full report.
Every Toyota Sienna year · Every Chrysler Pacifica year · How the index works