 The Lemon Index
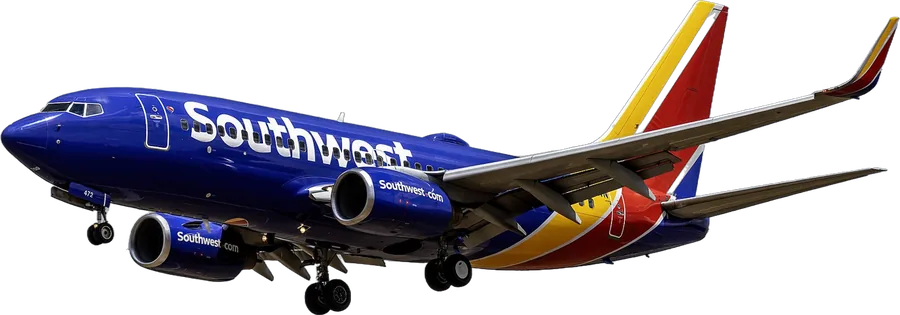
Photos: Acroterion (Wikimedia Commons)
141accidents
1%were fatal
1deaths
1%aircraft destroyed
What happened. NTSB's defining event, share of accidents.
Turbulence encounter33%
Ground collision11%
Cabin safety event9%
Tailstrike4%
Birdstrike3%
Prior to flight Ground handling event3%
Pilot or plane? How often NTSB listed an aircraft problem among the causes.
7%the plane was part of the cause
engine, systems, structure or propeller
engine, systems, structure or propeller
93%people or weather only
pilot decisions, control, fuel planning
pilot decisions, control, fuel planning
Out of 81 accidents where NTSB recorded a cause. When the plane was a cause, it was most often the fuselage.
When. Phase of flight.
Enroute43%
Taxi17%
Other9%
Approach9%
Standing9%
Accidents per year.
20084
20092
20106
201110
20125
20131
201412
20158
201613
20178
20188
201912
20203
20216
20229
20238
202411
202515
More planes flying means more accidents, so counts aren't a safety score by themselves. Compare the shares above.
Source: NTSB aviation accident database, U.S. accidents 2008–2025. ntsb.gov · Every plane
Updated