 The Lemon Index
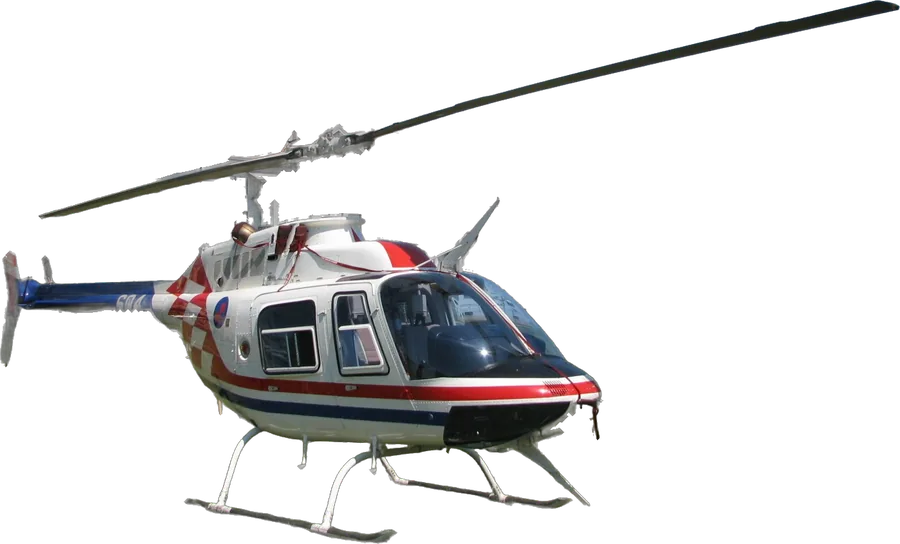
Photos: Ex13 (Wikimedia Commons)
351accidents
21%were fatal
157deaths
15%aircraft destroyed
What happened. NTSB's defining event, share of accidents.
Low altitude operation/event12%
Loss of control in flight11%
Loss of engine power (total)8%
Controlled flight into terr/obj (CFIT)5%
Dynamic rollover5%
Loss of tail rotor effectiveness5%
Pilot or plane? How often NTSB listed an aircraft problem among the causes.
22%the plane was part of the cause
engine, systems, structure or propeller
engine, systems, structure or propeller
78%people or weather only
pilot decisions, control, fuel planning
pilot decisions, control, fuel planning
Out of 231 accidents where NTSB recorded a cause. When the plane was a cause, it was most often the engine (turbine/turboprop).
When. Phase of flight.
Maneuvering42%
Enroute18%
Landing12%
Takeoff9%
Other6%
Accidents per year.
200821
200916
201019
201118
201226
201331
201420
201521
201617
201720
201810
201921
202012
202117
202227
202323
202417
202515
More planes flying means more accidents, so counts aren't a safety score by themselves. Compare the shares above.
Source: NTSB aviation accident database, U.S. accidents 2008–2025. ntsb.gov · Every plane
Updated