 The Lemon Index
All cars · Volkswagen · Car
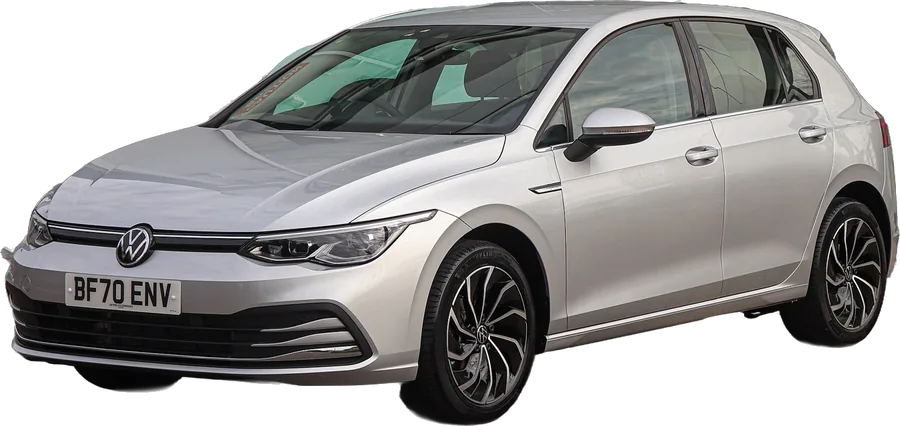
Volkswagen Golf.
The best Volkswagen Golf years are 2014, 2020, 2013. Years to avoid: 2019, 2002, 2001. Across 2010-2021, it has a Lemon Index of 170, where 100 is the average car and lower is better.
Reliability by year, 2000 to 2020.

Every year. Lower is better. Tap a year for its full report.
Scores before 2010 are rough: fewer owners filed complaints back then.
Best years to buy
2014.
Quick answers.
Is the Volkswagen Golf a good car?
Not overall: it draws more complaints than the average car, by owner complaints to the government per car sold (2010-2021: Lemon Index 170; 100 is average). Some years are much better than others: the best is 2014 and the worst is 2019.
What are the best Volkswagen Golf years to buy?
By owner complaints per car sold: 2014, 2020, 2013.
What Volkswagen Golf years should you stay away from?
The years with the most complaints per car sold: 2019, 2002, 2001.
How many recalls does the Volkswagen Golf have?
111 safety recalls across the 19 model years we track. Most: 2015 (12), 2001 (9), 2016 (9). Each year's page lists them.
What are the most common Volkswagen Golf problems?
Across every year, owners' complaints to the government name engine, transmission & drivetrain and electrical most. Some years are much worse than others: see the chart above.
Every year in one table
| Year | Index | Compared with average | Complaints | Top complaint | Recalls | Crash test | MPG |
|---|---|---|---|---|---|---|---|
| 2000 | 225 | 2.2× the average car's complaints | 70 | visibility (51%) | 8 | — | 22–33 |
| 2001 | 278 | 2.8× the average car's complaints | 92 | airbags (24%) | 9 | — | 22–33 |
| 2002 | 344 | 3.4× the average car's complaints | 141 | electrical (33%) | 7 | — | 23–38 |
| 2003 | 152 | 1.5× the average car's complaints | 41 | airbags (39%) | 6 | — | 23–38 |
| 2004 | 89 | 1.1× fewer complaints than average | 20 | electrical (35%) | 6 | — | 24–36 |
| 2006 | 145 | 1.4× the average car's complaints | 29 | transmission & drivetrain (31%) | 4 | — | 24–34 |
| 2007 | 146 | 1.5× the average car's complaints | 54 | transmission & drivetrain (52%) | 1 | — | — |
| 2008 | 143 | 1.4× the average car's complaints | 50 | transmission & drivetrain (82%) | 1 | — | — |
| 2010 | 196 | 2× the average car's complaints | 61 | fuel system, diesel (31%) | 5 | — | 25–32 |
| 2011 | 215 | 2.1× the average car's complaints | 87 | transmission & drivetrain (32%) | 6 | — | 26–32 |
| 2012 | 97 | about average | 43 | transmission & drivetrain (28%) | 6 | — | 22–32 |
| 2013 | 77 | 1.3× fewer complaints than average | 33 | engine (39%) | 5 | — | 22–32 |
| 2014 | 22 | 4.5× fewer complaints than average | 8 | airbags (38%) | 5 | — | 26–32 |
| 2015 | 175 | 1.8× the average car's complaints | 111 | electrical (27%) | 12 | ★★★★★ | 26–35 |
| 2016 | 139 | 1.4× the average car's complaints | 87 | electrical (18%) | 9 | ★★★★★ | 25–29 |
| 2017 | 169 | 1.7× the average car's complaints | 123 | engine (19%) | 6 | ★★★★★ | 25–29 |
| 2018 | 87 | 1.1× fewer complaints than average | 45 | brakes (22%) | 6 | ★★★★★ | 24–29 |
| 2019 | 601 | 6× the average car's complaints | 237 | engine (70%) | 6 | ★★★★★ | 24–32 |
| 2020 | 34 | 2.9× fewer complaints than average | 9 | engine (56%) | 3 | ★★★★★ | 31–32 |
Lemon Index = safety complaints filed with the government within 3 years, per car sold, against the average car of the same model year. 100 is average, lower is better. How it works
Updated
Free to use with credit: Source: The Lemon Index (lemonindex.com)
. Get the data