 The Lemon Index
Ford E-Series reliability.
Is it reliable? Yes, very. About a quarter as many complaints as the average car.
One of the most reliable · 2010–2022
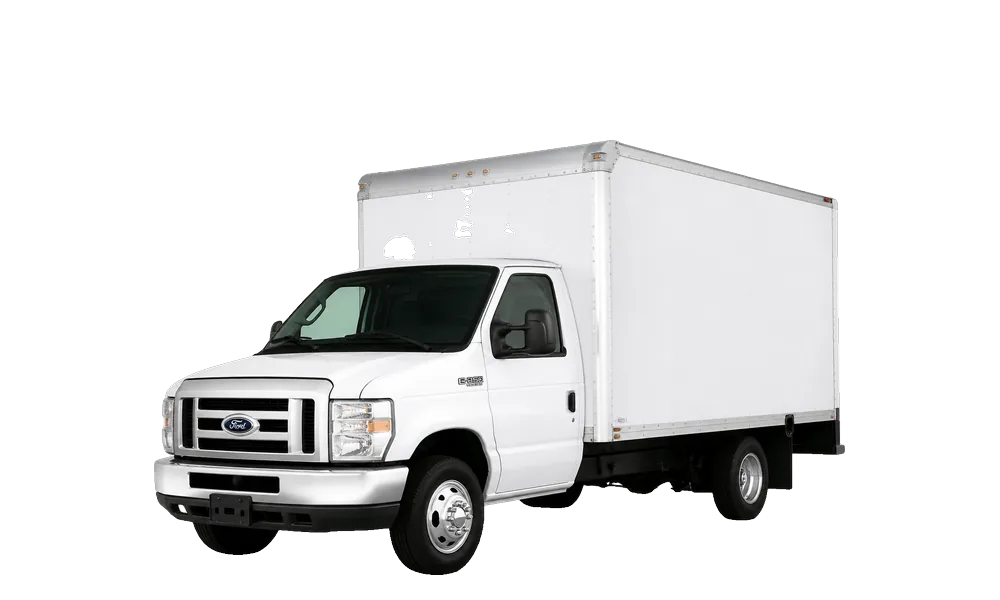
20215th generation
What owners say on YouTube: we haven't studied Ford E-Series videos yet. When that study runs, the most-watched owner reviews and buyer guides for each generation, and what owners praise and complain about, show up here.
Fewest complaints
2010.
Every year. Lower is better. Tap a year for its full report.
Newest year first. Red = worse than average, gray = about average, too new (2023+: a partial score, marked “partial”) or too few complaints to score.
Embed this chart
Put this chart on your site, blog or forum. Free, with the credit line built in.
<iframe src="https://lemonindex.com/embed/cars/ford-e-series/" title="Ford E-Series reliability by model year (The Lemon Index)" width="100%" height="698" style="border:0;max-width:720px" loading="lazy"></iframe><p style="font-size:13px;margin:4px 0 0">Data: <a href="https://lemonindex.com/cars/ford-e-series/">Lemon Index</a> (Ford E-Series reliability by year)</p>Scores before 2010 are rough: fewer owners filed complaints back then.
Compare the Ford E-Series.


Opens the compare tool with both cars, every year side by side. Compare with any car →
Quick answers.
Is the Ford E-Series reliable?
Yes, very. It draws about a quarter as many complaints as the average car. Fewest complaints: 2010.
Is the Ford E-Series a good car?
Yes, it is one of the most reliable models we track, by owner complaints to the government per car sold (2010-2022: Lemon Index 23; 100 is average). Some years are much better than others: 2010 drew the fewest complaints since 2010 and 2021 the most.
What are the best Ford E-Series years to buy?
By owner complaints per car sold since 2010: 2010, 2019, 2018. 2010 drew the fewest.
What Ford E-Series years should you stay away from?
No Ford E-Series year stands out as bad since 2010. Even the years with the most complaints per car sold beat the average car: 2021 (better than average, Lemon Index 51), 2016 (better than average, Lemon Index 50), 2022 (one of the most reliable, Lemon Index 49).
How many recalls does the Ford E-Series have?
298 safety recalls across the 23 model years we track. Most: 2006 (43), 2007 (36), 2008 (34). Each year's page lists them, and every Ford E-Series recall is in one list here.
What are the most common Ford E-Series problems?
Across every year, owners' complaints to the government name brakes, engine and tires most. Some years are much worse than others: see the chart above.
Every year in one table
| Year | Index | Compared with average | Complaints | Top complaint | Recalls | Crash test | MPG |
|---|---|---|---|---|---|---|---|
| 2000 | 54 | about half as many complaints as the average car | 112 | tires (42%) | 7 | — | — |
| 2001 | 37 | a bit under half as many complaints as the average car | 63 | service brakes, hydraulic (25%) | 4 | — | — |
| 2002 | 30 | about a third as many complaints as the average car | 51 | service brakes, hydraulic (27%) | 4 | — | — |
| 2003 | 36 | about a third as many complaints as the average car | 47 | service brakes, hydraulic (28%) | 10 | — | — |
| 2004 | 34 | about a third as many complaints as the average car | 49 | engine (37%) | 11 | — | — |
| 2005 | 44 | a bit under half as many complaints as the average car | 55 | engine (40%) | 19 | — | — |
| 2006 | 38 | a bit under half as many complaints as the average car | 43 | engine (42%) | 43 | — | — |
| 2007 | 16 | about a fifth as many complaints as the average car | 24 | tires (17%) | 36 | — | — |
| 2008 | 19 | about a fifth as many complaints as the average car | 23 | steering (35%) | 34 | — | — |
| 2009 | – | too few complaints to score | 9 | body structure (22%) | 27 | — | — |
| 2010 | 7 | less than a sixth as many complaints as the average car | 8 | electrical (38%) | 18 | — | — |
| 2011 | 17 | about a fifth as many complaints as the average car | 23 | tires (22%) | 20 | — | — |
| 2012 | 14 | less than a sixth as many complaints as the average car | 19 | wheels (21%) | 12 | — | — |
| 2013 | 14 | less than a sixth as many complaints as the average car | 22 | brakes (41%) | 10 | — | — |
| 2014 | 21 | about a fifth as many complaints as the average car | 26 | steering (19%) | 14 | — | — |
| 2015 | 23 | about a quarter as many complaints as the average car | 16 | transmission & drivetrain (31%) | 3 | — | — |
| 2016 | 50 | about half as many complaints as the average car | 27 | body structure (19%) | 5 | — | — |
| 2017 | 39 | a bit under half as many complaints as the average car | 22 | steering (32%) | 4 | — | — |
| 2018 | 14 | less than a sixth as many complaints as the average car | 7 | transmission & drivetrain (29%) | 5 | — | — |
| 2019 | 11 | less than a sixth as many complaints as the average car | 5 | fuel system (40%) | 0 | — | — |
| 2021 | 51 | about half as many complaints as the average car | 37 | steering (46%) | 6 | — | — |
| 2022 | 49 | about half as many complaints as the average car | 27 | steering (63%) | 3 | — | — |
| 2023 | – | too few complaints to score | 6 | engine (33%) | 3 | — | — |
The Lemon Index counts owner complaints filed with the U.S. government (NHTSA) in a car's first 3 years, per car sold, against the average car of the same model years (100 = average, lower is better). It measures complaints, not crash safety. U.S. sales source: en.wikipedia.org. How it works
Know someone shopping for a used car?
Updated · Free to use with credit: Source: The Lemon Index (lemonindex.com)
. Get the data