 The Lemon Index
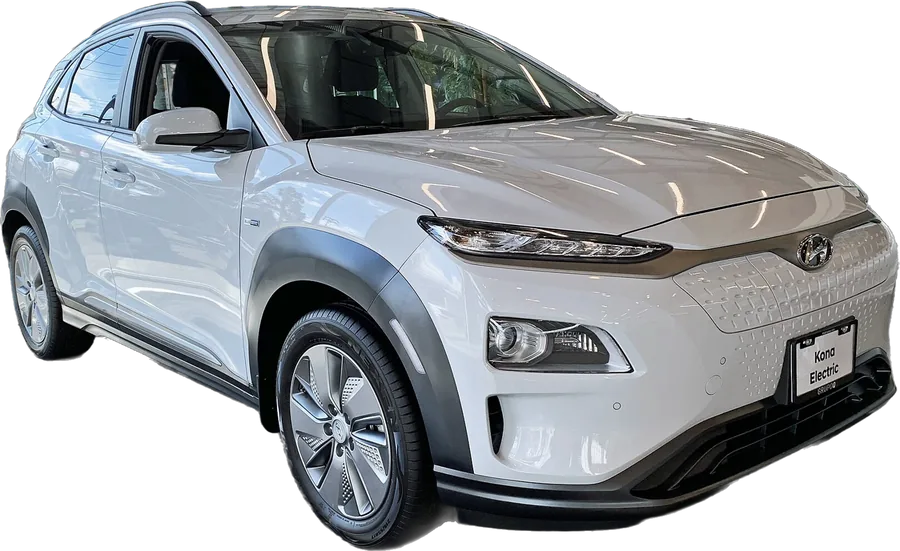
272Lemon Index (100 = average car)
144complaints per 100,000 sold
129without driver-assist complaints
27,045sold in the U.S., 2021-2024 (small sample)
Year by year
| Model year | Index | Compared with average | Complaints | Sold |
|---|---|---|---|---|
| 2021 | 306 | 3.1× the average car's complaints | 10 | 7,645 |
| 2022 | 171 | 1.7× the average car's complaints | 14 | 14,337 |
| 2024 | 526 | 5.3× the average car's complaints | 15 | 5,063 |
Top problems
- electrical: 72% of complaints
- motor and cooling: 13% of complaints
- brakes: 10% of complaints
- lights: 10% of complaints
Fire complaints: 1 (3.7 per 100,000 sold; all EVs average 0.8). EV fires vs gas →
Range and yearly cost
| EPA range (2025) | 200–261 miles |
| Electricity use | 29–31 kWh per 100 miles |
| Yearly charging cost (EPA) | $650–$700 |
| Hyundai Kona (gas twin), yearly gas cost | $2,050–$2,450 |
| Saves per year | about $1,575 |
EPA estimate: 15,000 miles a year at national average prices. Every EV's cost →
Recalls
3 recalls for model years 2021-2024. The newest:
- seat belts Jul 2026
The seat belt buckle in the rear center seat may fail to properly restrain an occupant during a crash. NHTSA 26V452000 - electrical Dec 2022
The Electric Power Control Unit (EPCU) may have been improperly sealed and may leak coolant internally. NHTSA 22V941000 - brakes Dec 2020
The Integrated Electronic Brake (IEB) system may detect an abnormal sensor signal and as a result, may significantly reduce braking performance. NHTSA 20V748000
Complaints filed with NHTSA by the end of the year after the model year. Sales are Kelley Blue Book estimates for every brand (Tesla doesn't report U.S. sales by model). These scores use a shorter window than the main Lemon Index (complaints filed by the end of the year after the model year), so brand-new EVs like the Cybertruck get a fair, complete window. That's why a Tesla's score here differs a little from its main car page. Sales source: Kelley Blue Book EV sales reports (estimates).