 The Lemon Index

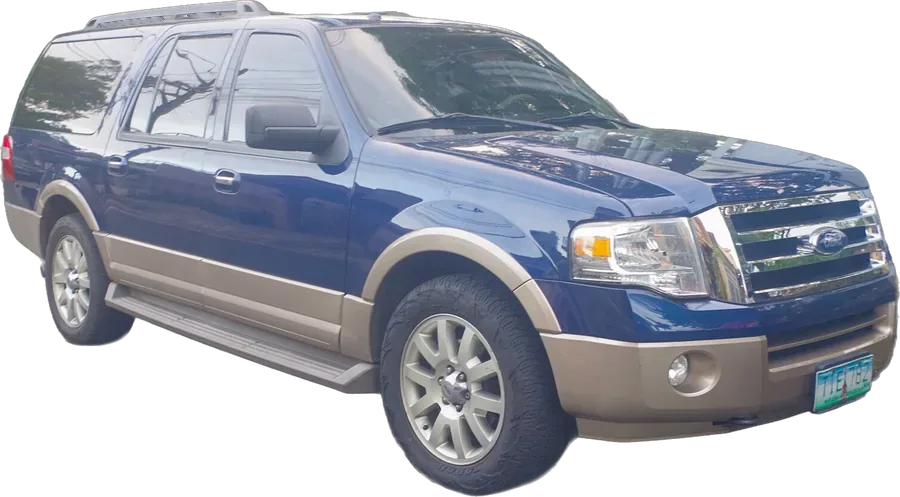
Verdict
Too close to call
Overall they drew about the same complaints per car sold (91 vs 98). Pick by model year below.
Head to head
Lemon Index
100 = average, lower is better
100 = average, lower is better
91
98
Years with fewer complaints
2000–2025
2000–2025
14 of 24
10 of 24
Recalls
2000–2025
2000–2025
132
147
MPG
latest year
latest year
16–23
18–19
Crash test
best, latest year
best, latest year
★★★★★
★★★★★
Best year to buy
Lemon Index = safety complaints filed with the government within 3 years, per car sold, against the average car of the same model year. 100 is average, lower is better. Green check = the better of the two on that line.
Year by year
Shorter bar = fewer complaints per car sold. Tap a year for its full report.
Every Chevrolet Suburban year · Every Ford Expedition year · How the index works