 The Lemon Index
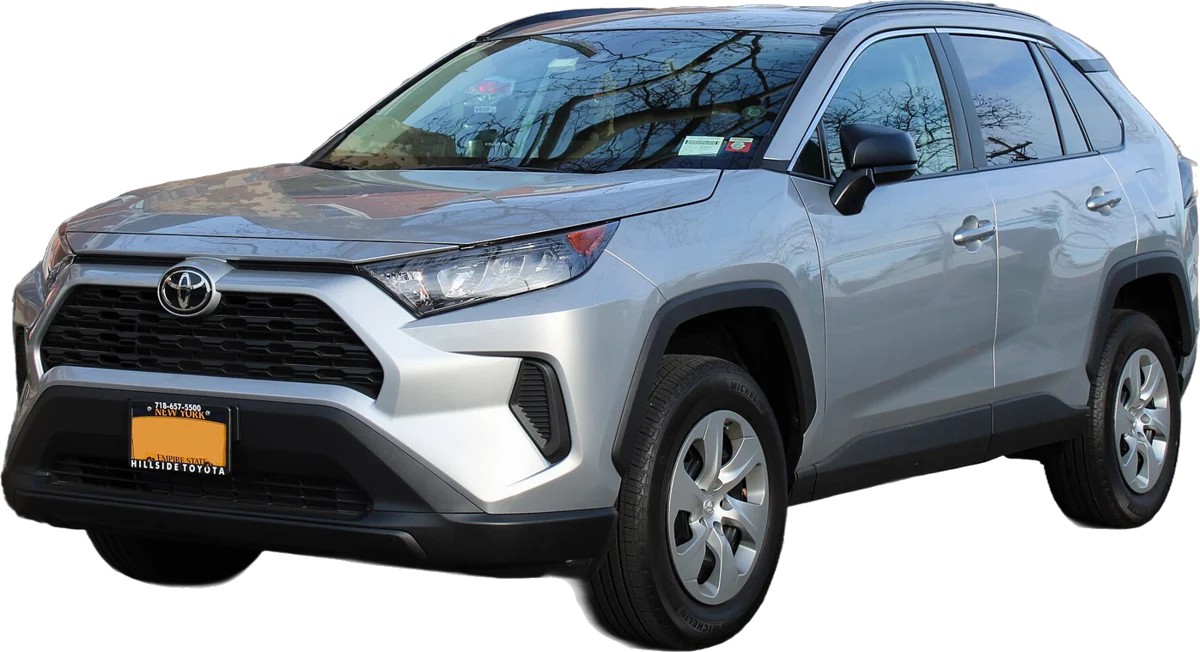
Toyota RAV4.
The best Toyota RAV4 years are 2014, 2022, 2015. Years to avoid: 2007, 2006, 2009. Across 2010-2022, it has a Lemon Index of 54, where 100 is the average car and lower is better.
Reliability by year, 2000 to 2025.
Every year. Lower is better. Tap a year for its full report.
Scores before 2010 are rough: fewer owners filed complaints back then.
What buyers watch before they buy.
From 60 YouTube videos about the 2026 Toyota RAV4, 1.4M views.
What owners say it costs
- Monthly payment / lease$1,3752 videos · most $750–$2,000Hear it ▶
Dollar amounts people say out loud in these videos (median, so one wild number can't swing it). Not verified sales; real prices depend on year, miles, condition and where you live. Tap Hear it to jump to the moment.
Most-watched topics
- Versus rivals331K views
 Battle of the best sellers. 2026 RAV4 or Honda CR V comparisonMotormouth · 112K views · 13 videos
- Reviews & first drives310K views
 8 Biggest Reasons to Avoid the All-New 2026 RAV4Motor Future · 82K views · 16 videos
- Interior, tech & features248K views
 2026 RAV4 Full Interior Tutorial: Features and Functions.Andre Drives · 92K views · 9 videos
- Owner reviews & long-term194K views
 2026 Honda CR-V -- As RAV4 Owners, Should We Have Bought THIS Instead??Car Confections · 125K views · 3 videos
Show 3 more
- Price, trims & which to buy155K views
 Wow, 2026 Prices are Lower!! // 2026 RAV4 PHEV Pricing AnnouncedMotormouth · 111K views · 6 videos
- Range, MPG & charging143K views
 SHOCKING! – We TEST the 2026 RAV4’s Claimed Fuel Economy! (Does it Get 40+ MPG??)Car Confections · 75K views · 7 videos
- Problems, recalls & complaints51K views
 2026 RAV4 Hybrid vs Plug-In Hybrid: Don't Make a $10,000 Mistake!AutoMobi · 32K views · 6 videos
Views show what people watch most, not how often something goes wrong. Videos belong to their creators; we link to them.
Best years to buy
2014.
Compare the Toyota RAV4.
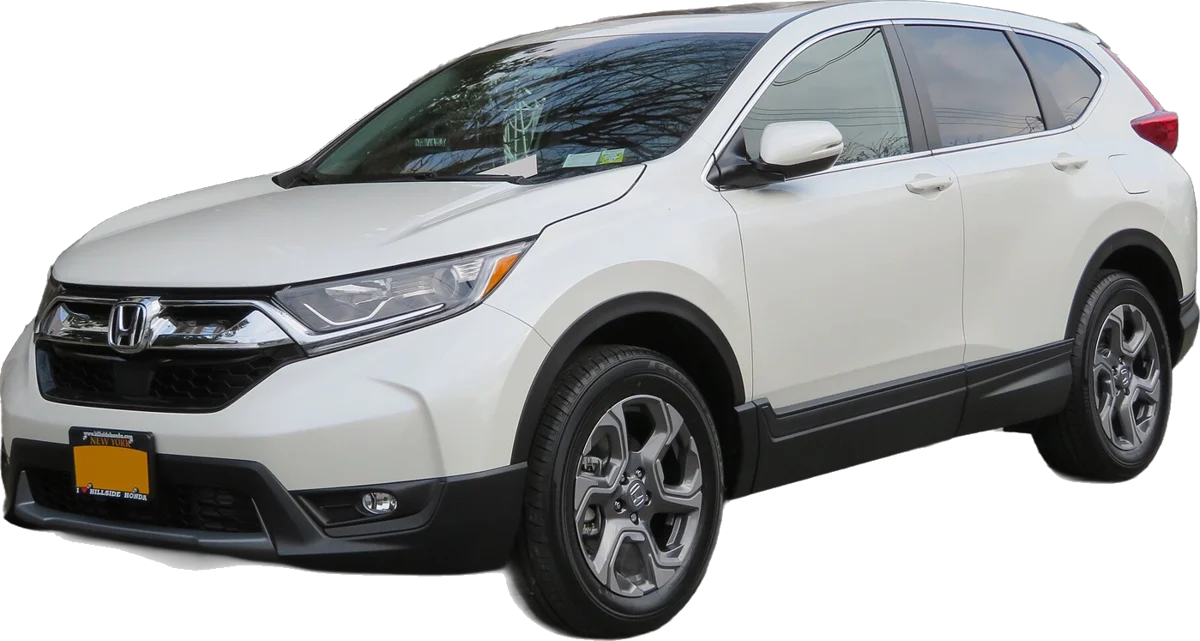
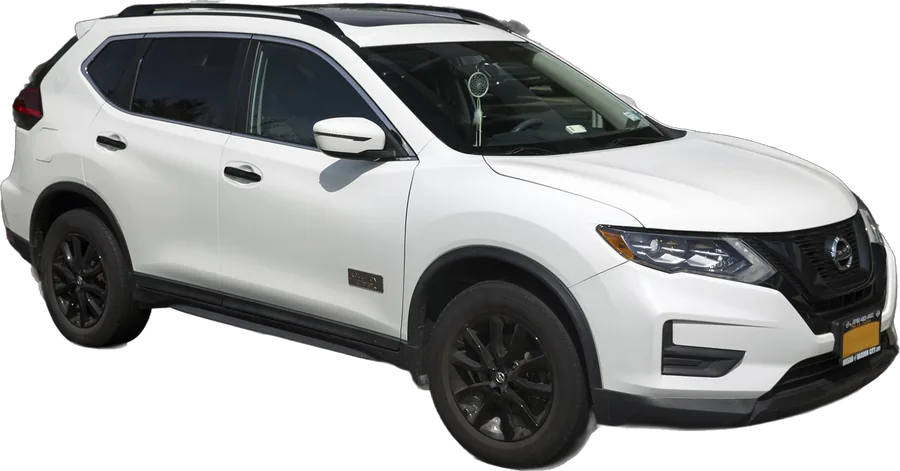
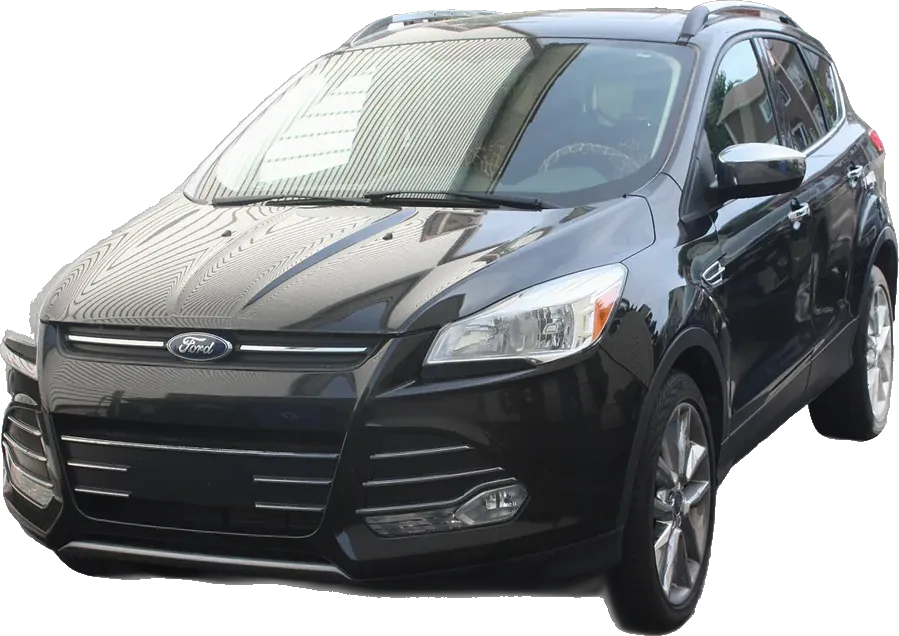
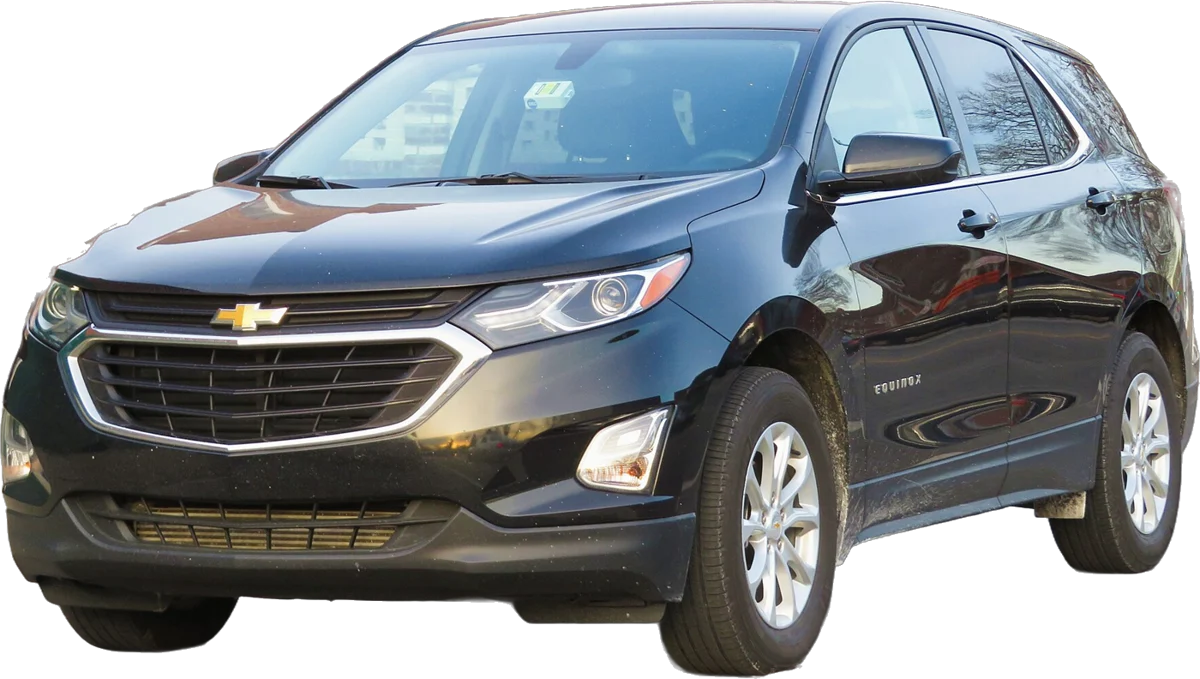

vs Honda CR-V · vs Nissan Rogue · vs Ford Escape · vs Chevrolet Equinox · vs Jeep Grand Cherokee · vs Ford Explorer · vs Toyota Highlander · vs Jeep Wrangler
Quick answers.
Is the Toyota RAV4 a good car?
Yes, it draws fewer complaints than the average car, by owner complaints to the government per car sold (2010-2022: Lemon Index 54; 100 is average). Some years are much better than others: the best is 2014 and the worst is 2007.
What are the best Toyota RAV4 years to buy?
By owner complaints per car sold: 2014, 2022, 2015.
What Toyota RAV4 years should you stay away from?
The years with the most complaints per car sold: 2007, 2006, 2009.
How many recalls does the Toyota RAV4 have?
143 safety recalls across the 26 model years we track. Most: 2009 (15), 2007 (14), 2008 (14). Each year's page lists them.
What are the most common Toyota RAV4 problems?
Across every year, owners' complaints to the government name electrical, speed control and engine most. Some years are much worse than others: see the chart above.
Every year in one table
| Year | Index | Compared with average | Complaints | Top complaint | Recalls | Crash test | MPG |
|---|---|---|---|---|---|---|---|
| 2000 | – | too few complaints to score | 10 | visibility (30%) | 3 | — | 21–72 |
| 2001 | 62 | 1.6× fewer complaints than average | 57 | service brakes, hydraulic (33%) | 0 | — | 22–72 |
| 2002 | 35 | 2.9× fewer complaints than average | 31 | airbags (23%) | 0 | — | 22–78 |
| 2003 | 35 | 2.9× fewer complaints than average | 22 | engine (23%) | 0 | — | 22–78 |
| 2004 | 38 | 2.6× fewer complaints than average | 23 | engine (17%) | 2 | — | 21–23 |
| 2005 | – | too few complaints to score | 16 | tires (38%) | 5 | — | 21–23 |
| 2006 | 145 | 1.4× the average car's complaints | 153 | steering (27%) | 11 | — | 21–24 |
| 2007 | 152 | 1.5× the average car's complaints | 233 | steering (31%) | 14 | — | 21–23 |
| 2008 | 104 | about average | 143 | speed control (47%) | 14 | — | 21–24 |
| 2009 | 127 | 1.3× the average car's complaints | 152 | speed control (52%) | 15 | — | 21–24 |
| 2010 | 81 | 1.2× fewer complaints than average | 153 | speed control (46%) | 14 | — | 21–24 |
| 2011 | 53 | 1.9× fewer complaints than average | 92 | speed control (43%) | 11 | ★★★☆☆ | 21–24 |
| 2012 | 56 | 1.8× fewer complaints than average | 104 | speed control (30%) | 5 | ★★★★☆ | 22–76 |
| 2013 | 44 | 2.3× fewer complaints than average | 117 | electrical (26%) | 2 | ★★★★☆ | 25–76 |
| 2014 | 20 | 5× fewer complaints than average | 58 | electrical (21%) | 4 | ★★★★☆ | 24–76 |
| 2015 | 33 | 3× fewer complaints than average | 100 | steering (18%) | 4 | ★★★★★ | 24–26 |
| 2016 | 37 | 2.7× fewer complaints than average | 131 | brakes (27%) | 3 | ★★★★★ | 24–32 |
| 2017 | 33 | 3× fewer complaints than average | 140 | brakes (20%) | 3 | ★★★★★ | 24–32 |
| 2018 | 38 | 2.6× fewer complaints than average | 164 | electrical (20%) | 3 | ★★★★★ | 24–32 |
| 2019 | 111 | 1.1× the average car's complaints | 508 | fuel or EV drive system (47%) | 7 | ★★★★★ | 28–40 |
| 2020 | 88 | 1.1× fewer complaints than average | 357 | fuel or EV drive system (24%) | 6 | ★★★★★ | 27–40 |
| 2021 | 80 | 1.2× fewer complaints than average | 319 | airbags (21%) | 5 | ★★★★★ | 28–40 |
| 2022 | 26 | 3.8× fewer complaints than average | 128 | electrical (23%) | 3 | ★★★★★ | 28–40 |
| 2023 | 45 | 2.2× fewer complaints than average | 233 | electrical (38%) | 3 | ★★★★★ | 28–40 |
| 2024 | 50 | 2× fewer complaints than average | 206 | electrical (20%) | 3 | ★★★★★ | 28–39 |
| 2025 | 33 | 3× fewer complaints than average | 95 | electrical (16%) | 3 | ★★★★★ | 28–39 |
Lemon Index = safety complaints filed with the government within 3 years, per car sold, against the average car of the same model year. 100 is average, lower is better. How it works
Updated
Free to use with credit: Source: The Lemon Index (lemonindex.com)
. Get the data