 The Lemon Index
Toyota Prius reliability.
Is it reliable? Not really. 1.8× the average car's complaints.
Worse than average · 2010–2022
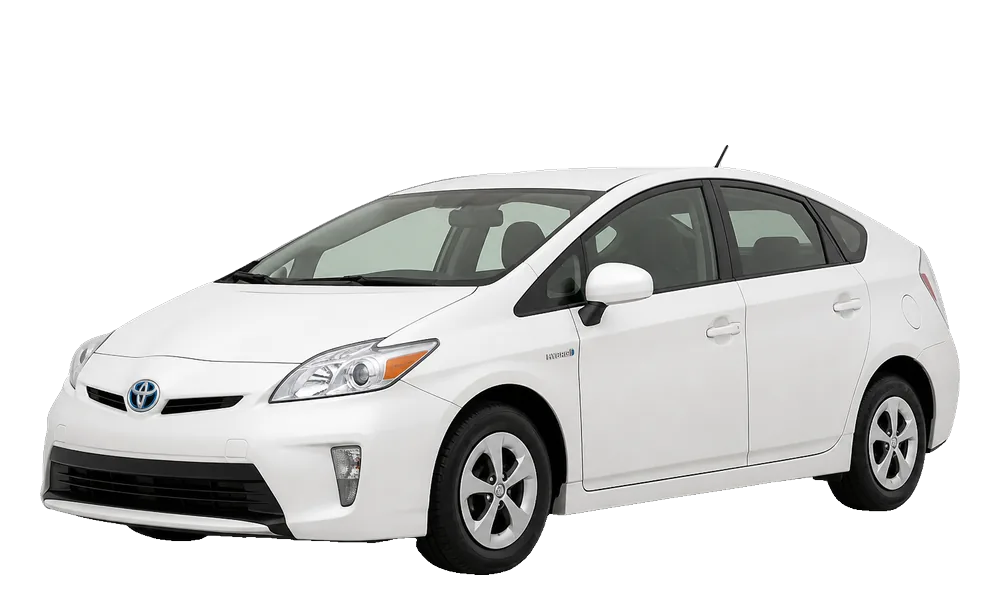
20153rd generation
What owners say on YouTube
2001–2003 Prius · 200 most-watched videos
Owners praise
Owners complain about
Nothing stands out.
Fixes owners look up most
- Infotainment, battery & electrical198K views
- Spark plugs & ignition coils126K views
- Starter, alternator & belts94K views
Before you buy, watch


2004–2009 Prius · 197 most-watched videos
Owners praise
Owners complain about
Fixes owners look up most
Before you buy, watch
 Top 5 Problems Toyota Prius Hybrid 2nd Generation 2004-20091A Auto: Repair Tips & Secrets Only Mechanics Know · 140K views
 2nd Gen Prius: The BIG Problems You NEED To Know About (And NO ONE Talks About Them)Drew's Garage · 124K views
 Easy Free fix // touch screen not working on Toyota Prius// 2nd Gen Prius Common problemsDiMasha · 82K views
2010–2015 Prius · 198 most-watched videos
Owners praise
Owners complain about
Fixes owners look up most
- Oil changes & service1.5M views
- Infotainment, battery & electrical1.3M views
- Intake, EGR & engine sensors912K views
Before you buy, watch
 Top 5 Problems Toyota Prius Hybrid 3rd Generation 2010-151A Auto: Repair Tips & Secrets Only Mechanics Know · 543K views
 2010 Toyota Prius Review - (High Mileage Reliability?)Jake Tiesler Auto · 173K views
 2011 - 2015 Prius Review! Real Fuel Consumption - Reliability - How to DriveDIY Approved · 87K views
2016–2022 Prius · 198 most-watched videos
Owners praise
Owners complain about
Fixes owners look up most
Before you buy, watch
 Toyota Prius Plus 2015-2019 | EVERYTHING you need to know... | should YOU buy one??Car and Driving - Car Reviews · 63K views
 Toyota Prius 4th Gen 2016 to 2021 common problems, issues, defects, recalls and complaintsHOWSTUFFINMYCARWORKS · 30K views
 Used 4th Gen Prius (2016-2022) Still a Smart Buy? Common Problems & ReliabilityAnother Lap · 26K views
2023–2025 Prius · 199 most-watched videos
Owners praise
Owners complain about
Nothing stands out.
Fixes owners look up most
Before you buy, watch


Praise and complaints: the share of each generation's most-watched videos that mention a topic with a praise or trouble word next to it, in the title or what's said. YouTube rank: how positive owners and reviewers sound, compared with every car of the same model year. It measures tone, not failure rates. Videos belong to their creators; we link to them.
Looking at a 2023 or newer? Those are too new for a full complaint score (any score shown is partial, in gray), but YouTube owners like the 2025 best.
Fewest complaints
2021.
Every year. Lower is better. Tap a year for its full report.
Newest year first. Red = worse than average, gray = about average, too new (2023+: a partial score, marked “partial”) or too few complaints to score. #1, #2… = that year's YouTube rank among the 24 Toyota Prius years with enough videos (#1 = the year owners and reviewers talk about most positively). It is not a reliability rank.
Embed this chart
Put this chart on your site, blog or forum. Free, with the credit line built in.
<iframe src="https://lemonindex.com/embed/cars/toyota-prius/" title="Toyota Prius reliability by model year (The Lemon Index)" width="100%" height="767" style="border:0;max-width:720px" loading="lazy"></iframe><p style="font-size:13px;margin:4px 0 0">Data: <a href="https://lemonindex.com/cars/toyota-prius/">Lemon Index</a> (Toyota Prius reliability by year)</p>Scores before 2010 are rough: fewer owners filed complaints back then.
YouTube rank: we read 988 YouTube videos about the Toyota Prius, 2001 to 2025, and ranked every year by how much they praise it vs. how much they talk about problems. YouTube's favorite: 2020. Old cars rank lower partly because most of their videos are repair and restoration videos. A gray dot means not enough data yet: under 10 videos, or a new year with no owner complaints to compare.
Compare the Toyota Prius.
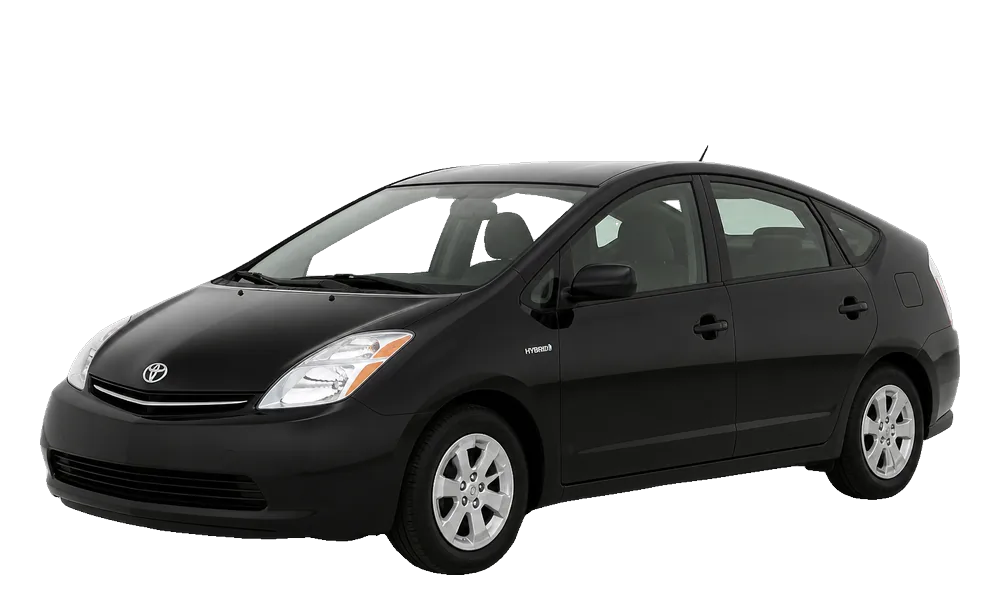
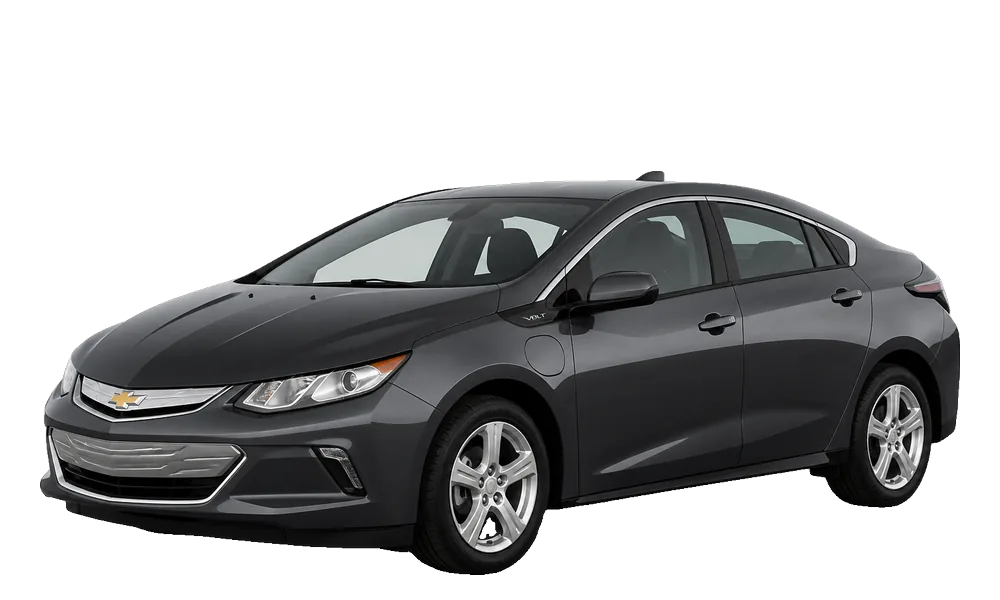

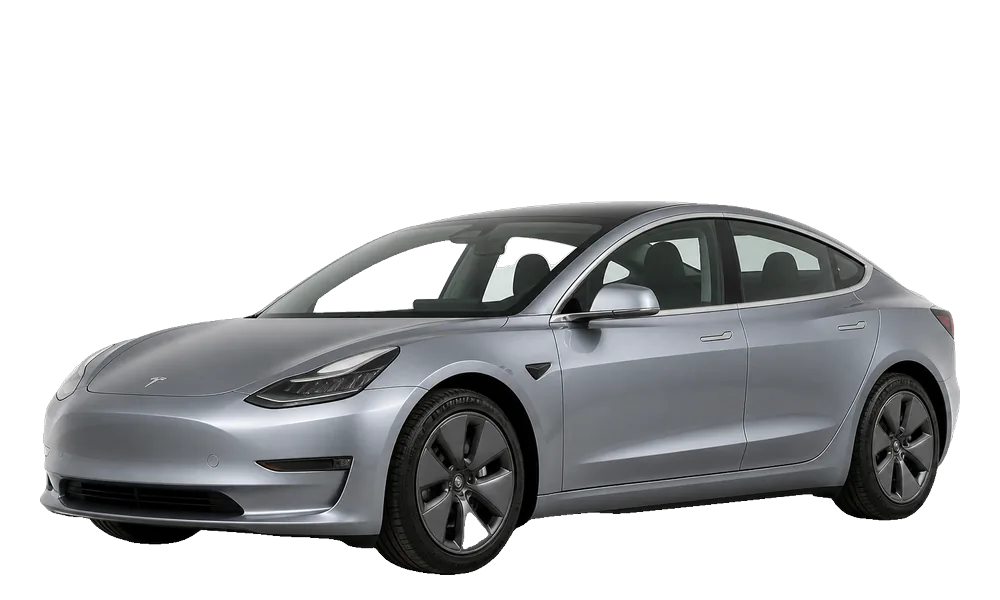
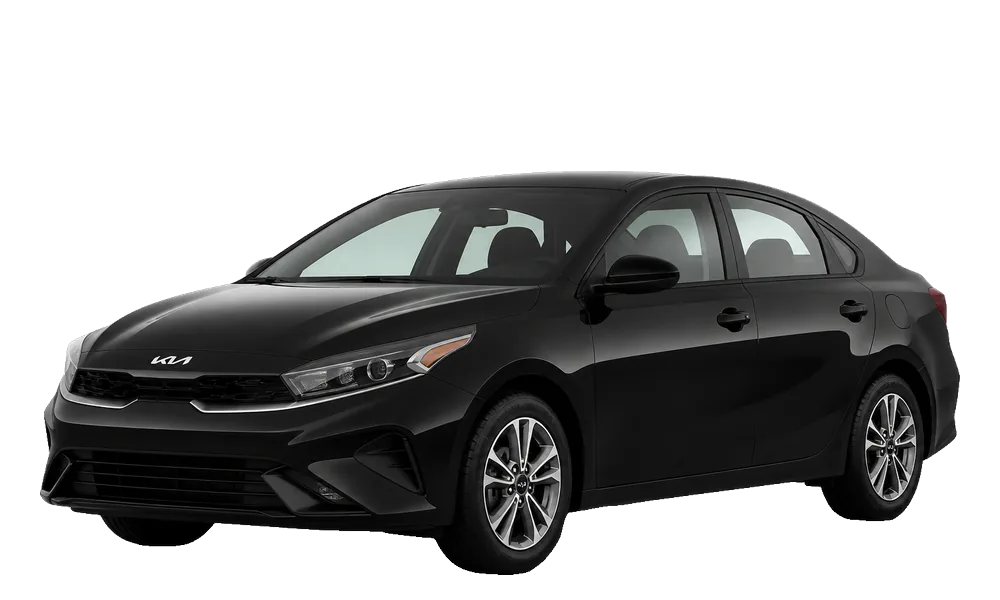
Opens the compare tool with both cars, every year side by side. Compare with any car →
Quick answers.
Is the Toyota Prius reliable?
Not really. It draws 1.8× the average car's complaints, and YouTube owners rate it about average for its age. Fewest complaints: 2021. Most complaints: 2010.
Is the Toyota Prius a good car?
Not overall: it draws more complaints than the average car, by owner complaints to the government per car sold (2010-2022: Lemon Index 179; 100 is average). Some years are much better than others: 2021 drew the fewest complaints since 2010 and 2010 the most.
What are the best Toyota Prius years to buy?
By owner complaints per car sold since 2010: 2021, 2019, 2020. 2021 drew the fewest.
What Toyota Prius years should you stay away from?
The 3 years with the most complaints per car sold since 2010: 2010 (avoid, Lemon Index 1107, the first year of a new generation), 2016 (about average, Lemon Index 98, the first year of a new generation), 2017 (better than average, Lemon Index 84). 100 is the average car; lower is better.
How many recalls does the Toyota Prius have?
90 safety recalls across the 25 model years we track. Most: 2010 (10), 2004 (6), 2005 (6). Each year's page lists them, and every Toyota Prius recall is in one list here.
What are the most common Toyota Prius problems?
Across every year, owners' complaints to the government name lights, brakes and brakes (electric) most. Some years are much worse than others: see the chart above.
Every year in one table
| Year | Index | Compared with average | Complaints | Top complaint | Recalls | Crash test | MPG |
|---|---|---|---|---|---|---|---|
| 2001 | 236 | about twice the average car's complaints | 53 | tires (45%) | 3 | — | 41 |
| 2002 | 229 | about twice the average car's complaints | 47 | tires (32%) | 2 | — | 41 |
| 2003 | 115 | a bit more than the average car's complaints | 23 | tires (39%) | 1 | — | 41 |
| 2004 | 490 | about 5 times the average car's complaints | 225 | electrical (47%) | 6 | — | 46 |
| 2005 | 248 | about twice the average car's complaints | 185 | electrical (25%) | 6 | — | 46 |
| 2006 | 987 | about 10 times the average car's complaints | 666 | lights (88%) | 6 | — | 46 |
| 2007 | 640 | about 6 times the average car's complaints | 1,026 | lights (64%) | 4 | — | 46 |
| 2008 | 467 | about 5 times the average car's complaints | 735 | lights (37%) | 4 | — | 46 |
| 2009 | 226 | about twice the average car's complaints | 254 | service brakes, hydraulic (37%) | 6 | — | 46 |
| 2010 | 1107 | about 11 times the average car's complaints | 1,788 | service brakes, hydraulic (49%) | 10 | — | 50 |
| 2011 | 66 | about two-thirds as many complaints as the average car | 105 | brakes (36%) | 6 | ★★★★★ | 48 |
| 2012 | 76 | about three-quarters as many complaints as the average car | 121 | wipers & visibility (21%) | 6 | ★★★★★ | 48 |
| 2013 | 46 | about half as many complaints as the average car | 84 | brakes (24%) | 3 | ★★★★★ | 48 |
| 2014 | 45 | about half as many complaints as the average car | 65 | electrical (25%) | 3 | ★★★★☆ | 48 |
| 2015 | 36 | about a third as many complaints as the average car | 42 | electrical (24%) | 1 | ★★★★☆ | 48 |
| 2016 | 98 | about average | 102 | wipers & visibility (34%) | 5 | ★★★★★ | 52–56 |
| 2017 | 84 | somewhat fewer complaints than the average car | 68 | wipers & visibility (22%) | 3 | ★★★★★ | 52–56 |
| 2018 | 25 | about a quarter as many complaints as the average car | 22 | wipers & visibility (23%) | 1 | ★★★★★ | 52–56 |
| 2019 | 14 | less than a sixth as many complaints as the average car | 11 | brakes (36%) | 3 | ★★★★★ | 50–56 |
| 2020 | 21 | about a fifth as many complaints as the average car | 10 | brakes (30%) | 0 | ★★★★★ | 50–56 |
| 2021 | 9 | less than a sixth as many complaints as the average car | 5 | engine (40%) | 0 | ★★★★★ | 49–56 |
| 2022 | 36 | about a third as many complaints as the average car | 19 | electrical (21%) | 1 | ★★★★★ | 49–56 |
| 2023 | 44 | a bit under half as many complaints as the average car | 20 | electrical (25%) | 4 | ★★★★★ | 49–57 |
| 2024 | 70 | about two-thirds as many complaints as the average car | 27 | lights (15%) | 4 | ★★★★★ | 49–57 |
| 2025 | – | too few complaints to score | 16 | electrical (38%) | 2 | ★★★★★ | 48–57 |
The Lemon Index counts owner complaints filed with the U.S. government (NHTSA) in a car's first 3 years, per car sold, against the average car of the same model years (100 = average, lower is better). It measures complaints, not crash safety. U.S. sales source: en.wikipedia.org. How it works
Know someone shopping for a used car?
Updated · Free to use with credit: Source: The Lemon Index (lemonindex.com)
. Get the data