 The Lemon Index
Nissan Rogue.
The best Nissan Rogue years are 2012, 2020, 2011, and no year drew much more than the average car's complaints. Across 2010-2022, it has a Lemon Index of 61, where 100 is the average car and lower is better.
Reliability by year, 2008 to 2025.
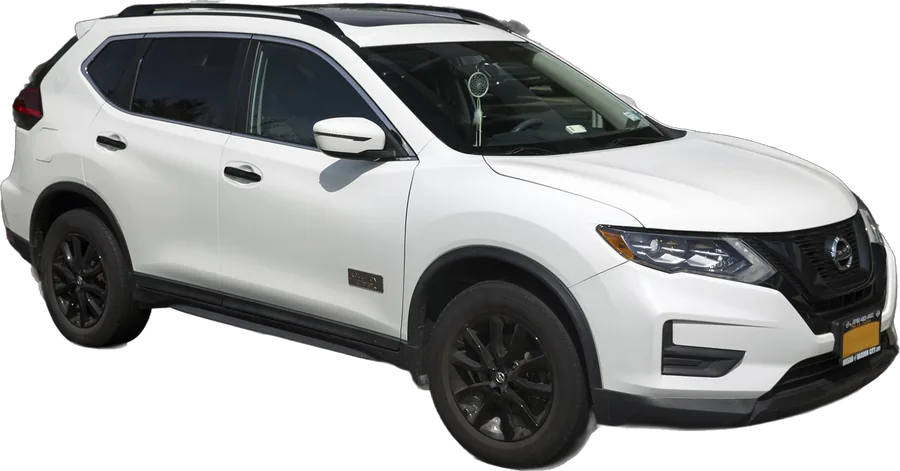
Every year. Lower is better. Tap a year for its full report.
Scores before 2010 are rough: fewer owners filed complaints back then.
Best years to buy
2012.
Years to avoid
None.
No Nissan Rogue year drew much more than the average car's complaints.
Compare the Nissan Rogue.
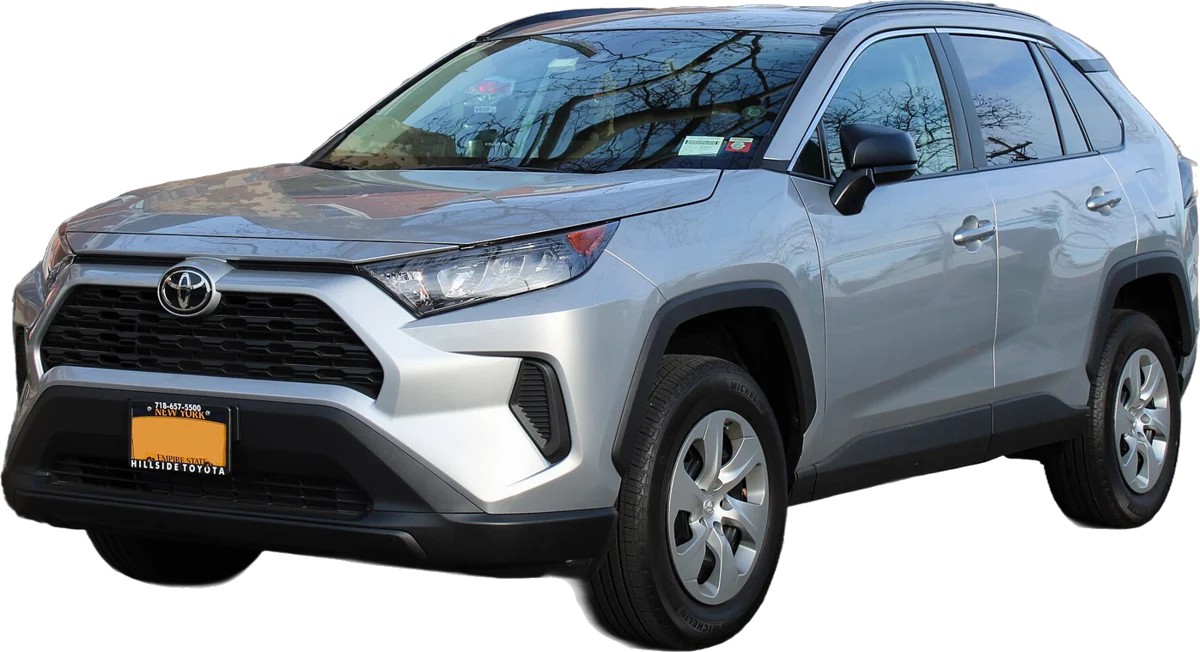
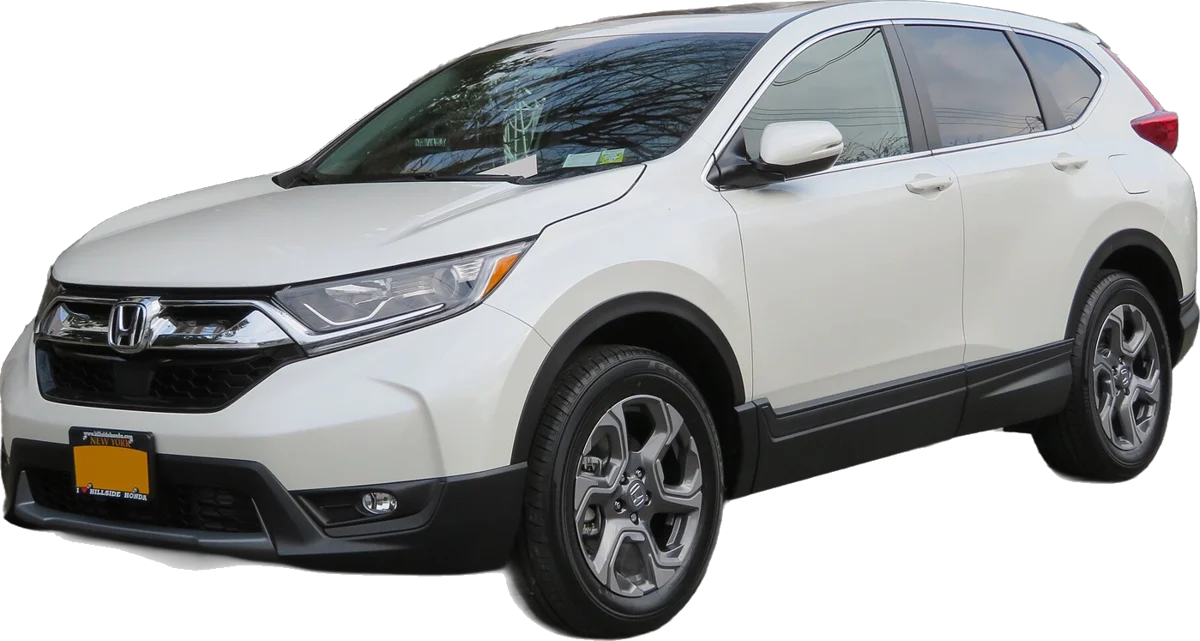

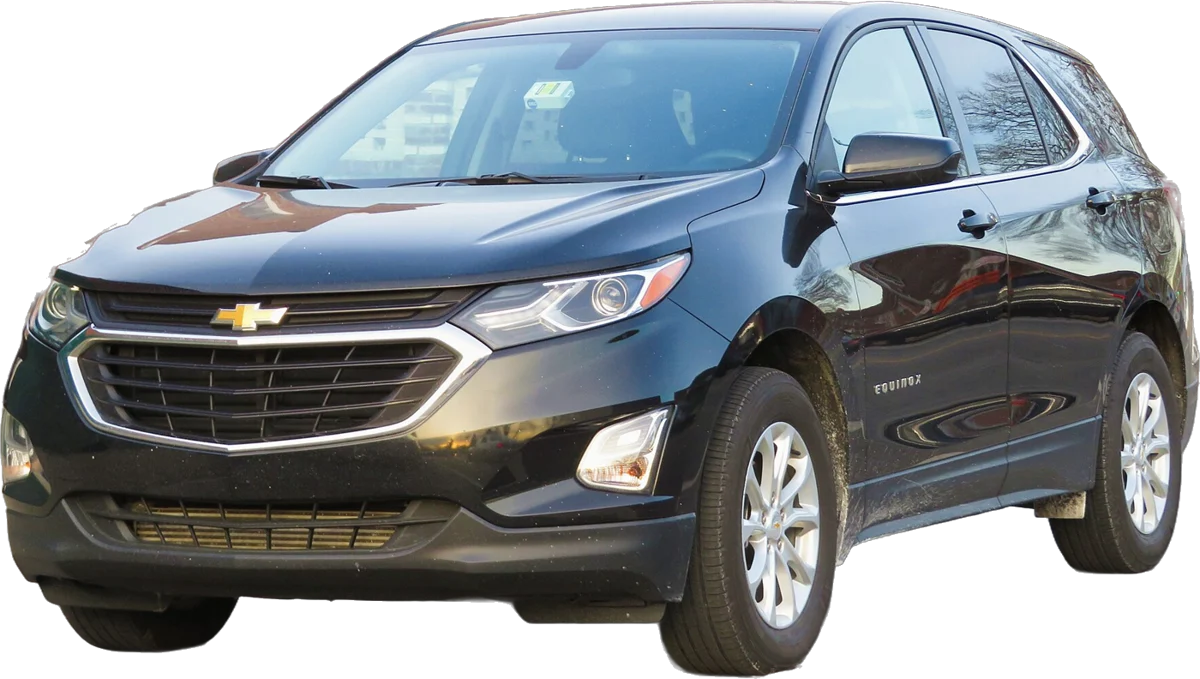

vs Toyota RAV4 · vs Honda CR-V · vs Ford Escape · vs Chevrolet Equinox · vs Jeep Grand Cherokee · vs Ford Explorer · vs Toyota Highlander · vs Jeep Wrangler
Quick answers.
Is the Nissan Rogue a good car?
Yes, it draws fewer complaints than the average car, by owner complaints to the government per car sold (2010-2022: Lemon Index 61; 100 is average). Some years are much better than others: the best is 2012 and the worst is 2018.
What are the best Nissan Rogue years to buy?
By owner complaints per car sold: 2012, 2020, 2011.
What Nissan Rogue years should you stay away from?
No Nissan Rogue year drew much more than an average car's complaints.
How many recalls does the Nissan Rogue have?
82 safety recalls across the 18 model years we track. Most: 2014 (10), 2021 (10), 2015 (9). Each year's page lists them.
What are the most common Nissan Rogue problems?
Across every year, owners' complaints to the government name engine, transmission & drivetrain and brakes most. Some years are much worse than others: see the chart above.
Every year in one table
| Year | Index | Compared with average | Complaints | Top complaint | Recalls | Crash test | MPG |
|---|---|---|---|---|---|---|---|
| 2008 | 76 | 1.3× fewer complaints than average | 70 | transmission & drivetrain (57%) | 5 | — | 23–24 |
| 2009 | 61 | 1.6× fewer complaints than average | 38 | transmission & drivetrain (34%) | 3 | — | 23–24 |
| 2010 | 48 | 2.1× fewer complaints than average | 52 | transmission & drivetrain (48%) | 2 | — | 23–24 |
| 2011 | 40 | 2.5× fewer complaints than average | 58 | transmission & drivetrain (52%) | 2 | ★★★★☆ | 24 |
| 2012 | 34 | 2.9× fewer complaints than average | 52 | transmission & drivetrain (37%) | 2 | ★★★★☆ | 23–25 |
| 2013 | 58 | 1.7× fewer complaints than average | 115 | transmission & drivetrain (38%) | 1 | ★★★★☆ | 24–25 |
| 2014 | 70 | 1.4× fewer complaints than average | 153 | fuel or EV drive system (26%) | 10 | ★★★★☆ | 24–28 |
| 2015 | 52 | 1.9× fewer complaints than average | 146 | airbags (25%) | 9 | ★★★★☆ | 24–28 |
| 2016 | 43 | 2.3× fewer complaints than average | 143 | airbags (22%) | 7 | ★★★★☆ | 27–28 |
| 2017 | 62 | 1.6× fewer complaints than average | 265 | brakes (29%) | 5 | ★★★★☆ | 27–34 |
| 2018 | 104 | about average | 434 | brakes (52%) | 3 | ★★★★☆ | 27–34 |
| 2019 | 59 | 1.7× fewer complaints than average | 223 | brakes (45%) | 3 | ★★★★☆ | 27–34 |
| 2020 | 35 | 2.9× fewer complaints than average | 84 | automatic emergency braking (60%) | 1 | ★★★★☆ | 27–29 |
| 2021 | 55 | 1.8× fewer complaints than average | 151 | electrical (21%) | 10 | ★★★★★ | 27–33 |
| 2022 | 63 | 1.6× fewer complaints than average | 165 | engine (51%) | 6 | ★★★★★ | 27–33 |
| 2023 | 230 | 2.3× the average car's complaints | 740 | engine (39%) | 6 | ★★★★★ | 31–33 |
| 2024 | 98 | about average | 216 | engine (31%) | 4 | ★★★★★ | 31–33 |
| 2025 | 140 | 1.4× the average car's complaints | 194 | wipers & visibility (25%) | 3 | ★★★★★ | 29–33 |
Lemon Index = safety complaints filed with the government within 3 years, per car sold, against the average car of the same model year. 100 is average, lower is better. How it works
Updated
Free to use with credit: Source: The Lemon Index (lemonindex.com)
. Get the data